B0: Blog post on data source
The aim of this assignment is to locate a data resource online that interests you and describe it. I have provided links to a number of resources here.
First, describe the characteristics of the data source.
- What makes it interesting to you?
- What are its numerical and categorical variables?
- Is it a time series?
- Are there any clear response variables and explanatory variables?
Next, briefly discuss a couple of questions that could possibly be answered by analyzing the data. You may also discuss whether there is any potential to link the data source with another data source to answer further questions, and how that might be done.
What to turn in
First, you must set up a blog. One option is to sign up for one through Google Sites on your wellesley.edu Google account. Another is to sign up with a wordpress or blogspot account. Whatever you choose, please email me with the URL of your blog and the URL of the blog post so I can access it.
The word limit for the post is 500 words. Please feel free to embed images and links as you see fit.
How you will be graded
Here is the rubric I will be using to help me assess your writing in the blog post. I plan to use a similar rubric throughout the semester when assessing your writing, as a way to help give you consistent guidance on where you are doing well in the writing, and where you can improve.
| Aspect | Level 1 | Level 2 | Level 3 | Level 4 |
|---|---|---|---|---|
| Topic selection | unsuitable or irrelevant | suitable topic, but unclear connection to data | suitable topic with connection to data | novel topic |
| Motivation/rationale | no clear rational or weak rationale | some rationale presented, begins to motivate the selected topic | provides and discusses a suitable motivation | persuasive and creative motivation |
| Data description | no description of data or variable types | partial description of data; incomplete or incorrect discussion of variable types | sufficient description of data and variable types with only minor errors | error-free description of data and variable types |
| Discussion | no discussion of potential analysis or linking to data sources | limited discussion of potential analysis or linking to data sources | either discussion of potential analysis or linking to data sources | insightful discussion of potential analysis or linking to data sources |
| Grammar and spelling, usage | significantly impairs readability | frequent or serious errors | some minor errors | virtually no errors |
| Organization | needs significant reorganization | structure is of inconsistent quality, may have choppy transitions and/or redundancies or disconnections | structure supports the argument, clearly ordered sections fit together well | structure enhances the argument, strong sections and seamless flow |
| Clarity, style, readability | gets in the way of reading for content | beginning to be comfortable with appropriate conventions, but style is inconsistent or uneven | effective prose style, follows relevant conventions, emergence of voice | mastery of the genre, including elegant style, established voice |
Portions of this rubric were based on a writing assessment rubric developed by Carol Trosset, Grinnel College.
Example post
The Chilling Effects clearinghouse offers an excellent source of data on online cease-and-desist notices. The goal of the site is to increase transparency of limitations of speech online. Most notices concern alleged copyright violations sent by rights holders to websites hosting the content. Anyone can submit reports to Chilling Effects, though most of the reports in the database appear to come from a few large websites including Google, Twitter and Wikipedia.
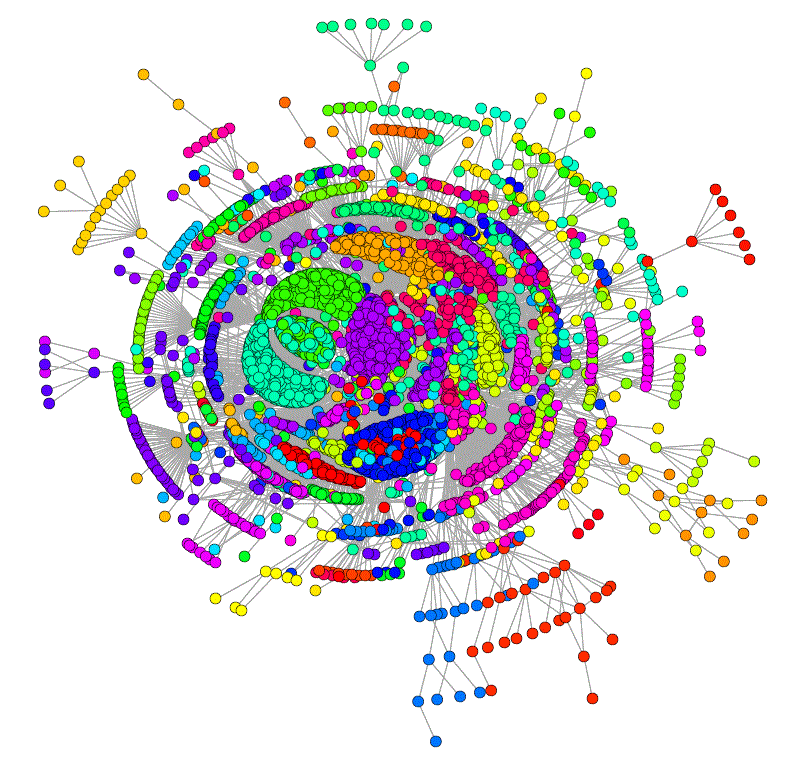
I find the data source especially interesting in light of recent protests over the Stop Online Piracy Act (SOPA). SOPA would have allowed rights holders to block entire websites deemed to be dedicated to copyright infringement. The notices in the Chilling Effects database, by contrast, concern individual URLs on websites. This makes the notices more targeted, but it also means that many more notices are generated: the Chilling Effects database includes over 10,000 distinct notices!
Each record includes a mixture of structured and unstructured data. Here is a screenshot of some reports:
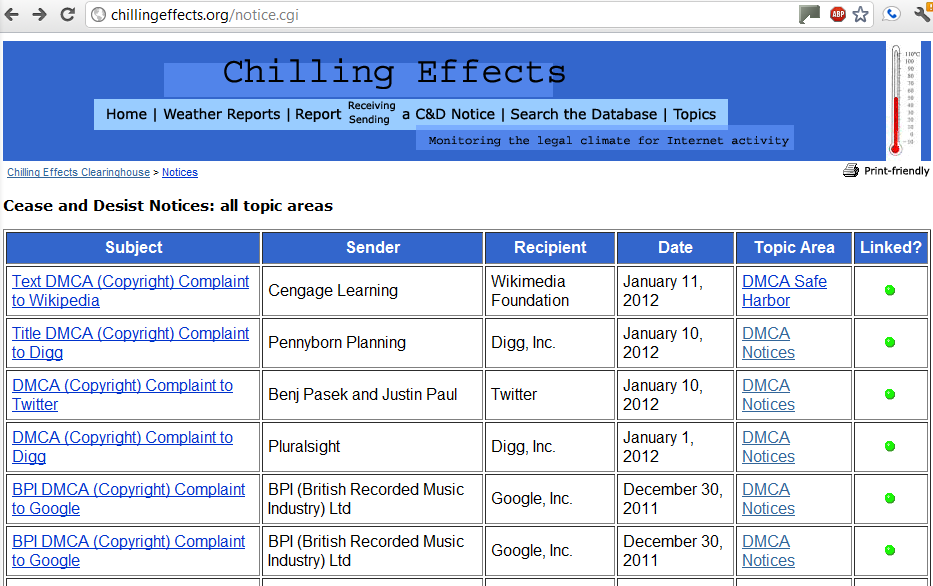
Each record includes a subject, sender, recipient, data and topic area. The sender, recipient and topic area are categorical variables. Grouping by sender, for instance, could uncover the most frequent complainants, or reveal differences in behavior across senders. Each notice also includes the date of submission, so there is great potential to construct a time series. In fact, because the data just includes records, one would need to construct appropriate numerical response variables. For instance, one could simply count the number of reports issued each month, and track whether the number is increasing or not.
There is also additional data available that could be extracted from the reports themselves. However, as presented, the reports are simply given in letter form. For example, here is a notice sent to Digg:
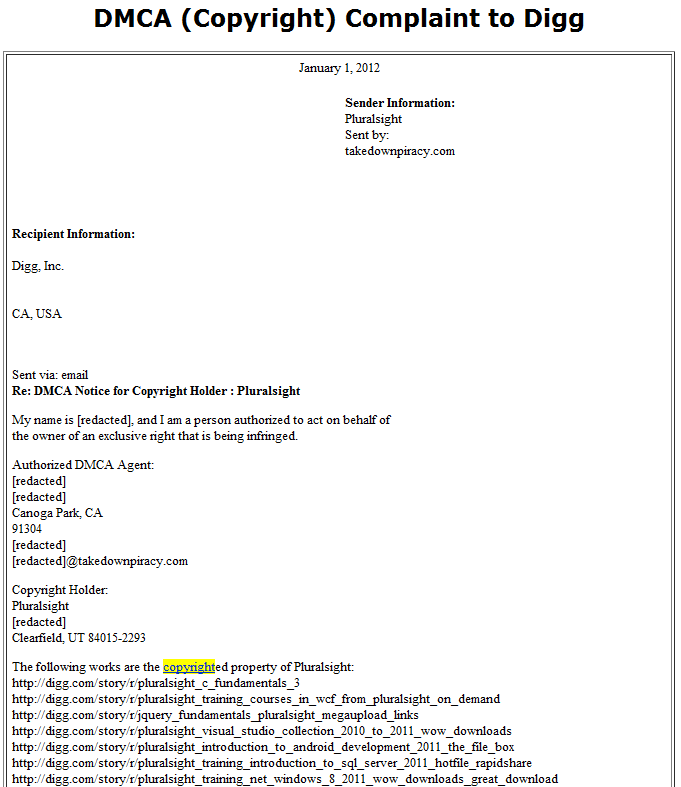
These letters appear to follow a particular form, so it may be possible to extract additional information. In particular, the letters include the allegedly infringing URLs, which would be useful to know.
Given such rich information, I can envision several interesting questions to investigate further. SOPA's proponents claim that a few persistent foreign websites carry out most infringing activities. One could test this theory by inspecting the websites of infringing URLs over time. Do the same websites appear repeatedly for a long time, or do the websites change frequently? Are the worst offenders actually hosted abroad? One could issue WHOIS requests on the domains appearing in notices to see the claimed country of origin. It would be really fun to inject some data-driven arguments into the debate over SOPA.