H3: R Data Exploration
Download the data set of in- vs. out-of state Senate contributions created for H2 from http://cs.wellesley.edu/~qtw/data/invsout_fix.csv.
Recall the questions that motivated the data collection from H2:
Suppose your friend Polly, a political science major, mentions a hypothesis to you over dinner. She feels strongly that out-of-state political contributions undermine democracy since the contributions come from people outside a politician's constituency. She thinks that incumbent Senators are more likely to receive out-of-state donations than challengers. She suspects that out-of-state contributions have grown over time. Finally, she doesn't know whether Republicans or Democrats are more likely to receive more out-of-state contributions, but she would love to know the answer. Unfortunately, Polly doesn't know how to code, and so she is overwhelmed by the prospect of sifting through millions of records to find answers.
In this assignment you will use R to help analyze the data to answer each of these questions.
Task 1: Initial exploration
Please note that there were a couple of bugs in the data set as originally posted. First, some students pointed out that there were too many peopl who "won" Senate races in 1996 (85 senators, when usually only a third of Senators are up for election in any given cycle). I have written some scripts to remove the spurious wins. Second, I realize that R does not deal very well with the data as presented -- a few hundred rows simply disappear when you read the file in. Consequently I have prepared a new file with quotes surrounding all strings located at http://cs.wellesley.edu/~qtw/data/invsout_fix.csv. To help save time, here is the line of code you will need to read the file in properly:
cont<-read.table('http://cs.wellesley.edu/~qtw/data/invsout_fix.csv',sep=',',header=T,fill=T,quote='"')
Note that you don't have to use the same variable name as me here, particularly if you have already started the assignment before these updated instructions were posted.
Task 1.1: Initial cleanup
First notice that the data includes some implausible figures, such as negative contributions. Create a new data frame that excludes any row with a negative in-state or out-of-state contribution.
Task 1.2: Focus on election-year contributions
Look at the entries for a few of your favorite Senators. Notice how often the report having raised money. Given that Senators serve six-year terms, can you see the discrepancy? Create another data frame that only includes rows during election years. This can be done using a logical vector with a single condition. If you have trouble figuring out what to do, look up a few Senators on Wikipedia in order to figure out which years they run for election. For example, here are the entries for John Kerry:
> cont[cont$CandName=='John Kerry (D)',]
           CandName CandSt Party IsIncumbent Cycle Won NumInStateC SumInStateC
4    John Kerry (D)     MA     D           I  1990   W        3539     1962991
517  John Kerry (D)     MA     D           I  1992             451      265297
853  John Kerry (D)     MA     D           I  1994             662      523760
1039 John Kerry (D)     MA     D           I  1996   W        4484     2320160
1432 John Kerry (D)     MA     D           I  1998            2439     1532170
1791 John Kerry (D)     MA     D           I  2000            1128      809380
2090 John Kerry (D)     MA     D           I  2002   W        3713     2275321
2742 John Kerry (D)     MA     D           I  2006             136      130022
3044 John Kerry (D)     MA     D           I  2008   W         756      709835
3303 John Kerry (D)     MA     D           I  2010            1027     1362151
     NumOutStateC SumOutStateC
4            3163      2265344
517           314       210637
853           333       321773
1039         4126      3885543
1432         2035      1470094
1791         1503      1157250
2090         5051      9065515
2742         1232      6943569
3044         1950     14710542
3303          662       909867
Can you tell which rows actually represent election years?
For the subsequent parts of the assignment, use this modified data frame that only includes positive contributions during election years.
Task 2: Answer the question: are incumbent Senators more likely to receive out-of-state donations than challengers?
To answer this question, you should first append a new column to your data frame, one that lists the fraction of the monetary contributions that come from in state.
You should then plot a CDF of the fraction of in-state contributions per campaign. Save the graph as ecdf_instate_frac_ey.png in the figs directory. It should look like this:
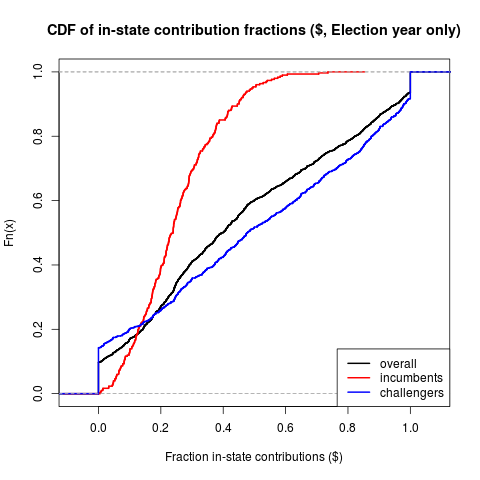
Answer the following questions based on this graph:
- Based on this graph, how would you answer the question for this task? Please explain.
- Roughly what percentage of incumbent senators get more than half of their contributions from out-of-state (during an election year)? You can eye-ball the percentage from the graph.
- Roughly what percentage of senate challengers get more than half of their contributions from out-of-state (during an election year?
- As a proportion, do more incumbent senators receive at least 2/3 of their contributions in-state, or do more challengers receive 100% of their contributions in-state?
Task 3: Answer the question: Do Republicans or Democrats receive more out-of-state contributions?
- Use the
tapplyfunction twice to compute the total contributions to all political parties for in state and out of state contributions.
- Additionally, compute the fraction of out-of-state contributions for different parties. Which party receives more out-of-state contributions as a proportion?
Task 4: Answer the question: have out-of-state contributions grown over time?
To answer Polly's final question, create two mosaic plots comparing in-state contributions to out-of-state contributions over time:
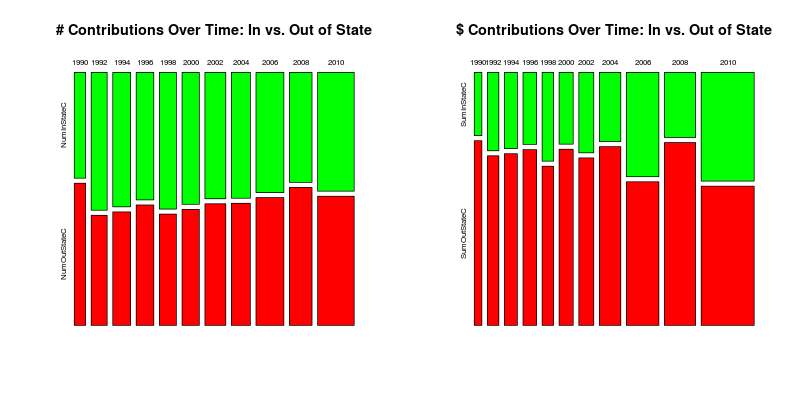
Save the graph as invsout_time.png in the figs directory. After making the graph, answer the following questions:
- Have the number of out-of-state contributions grown over time, either in absolute numbers or as compared to in-state contributions?
- Have the total dollar contributions from out-of-state grown over time, either in absolute figures or as compared to in-state contributions?
What to turn in
Include all code in the R file named h3.r. Create a directory under qtw called h3, along with subdirectories labeled code and figs. Place h3.r in the code directory. Place the R figures you create in the figs directory, along with a document answering each of the questions asked in the assignment. Name that file h3explore.pdf (please match case and naming exactly). Please include the figures in that document as well.
Your code should be well-documented. I will be able to read any files or directories placed in the qtw directory. This means there is nothing for you to do to submit the homework, aside from putting it in the right place.
Please do not modify h3.r after the submission deadline. I will check the modification timestamp to verify an on-time submission. Also, be sure to put your name on the top of h3.r. Please remember to submit only one version of the code and figures with both names on the code.